IoP - Control logic details - and a Raspberry Pi
The control logic is implemented in the IrrigationController class. Because it usually is hard to describe program flow details in text form, I created some flow charts.

The control logic is implemented in the IrrigationController class. Because it usually is hard to describe program flow details in text form, I created some flow charts. They are not 100% accurate, i.e. they leave out some details and are drawn a little different than actually implemented for better "readability".
The logic is implemented within a (FreeRTOS) task. I chose using a task to have the flexibility to keep the controller running all the time (e.g. in the development and configuration phase) or run the task just once every "now and then" and put the processor into deep sleep most of the time.
The following flow chart shows the initialization phase of the task. There is nothing special there: It basically waits for WiFi and the system time being set. Both waiting times do have a timeout. That is to ensure the controller tasks comes up without a network connection.
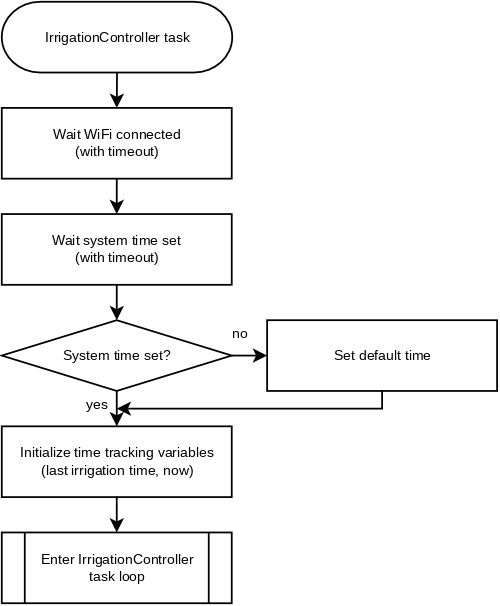
After initialization the task enters its task loop. It doesn't explicitly exit it ever. The only time it "exits" is when the processor enters deep sleep, because a wakeup from this state will reboot the system right from the very beginning.
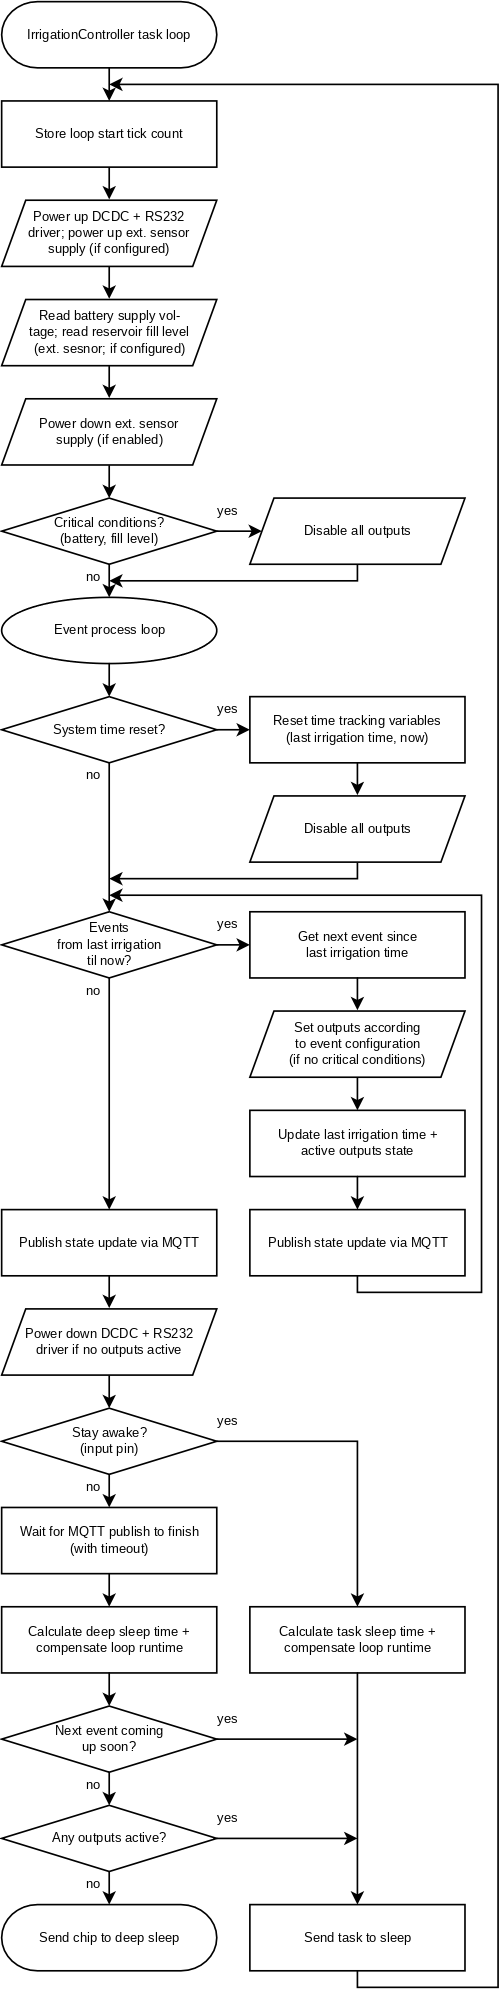
In essence, the task loop does the following:
- Collect (internal and external) sensor data.
- Check for critical conditions (and disable an active irrigation if detected).
- Process all irrigation events that (may have) occurred since the last loop run. This ensures that no event will be missed, even if the task loop run gets scheduled a little too late by the OS.
- Publish the current state (i.e. sensor data and irrigation event info) via MQTT (if a network connection has been established).
- Decide whether to deep sleep or to "lightly" sleep by a task delay/yield.
Testing the control logic
To test the control logic over several days, I setup a data logger on a Raspberry Pi Zero-W board. It's hooked up via its GPIOs to the relay outputs of my board.
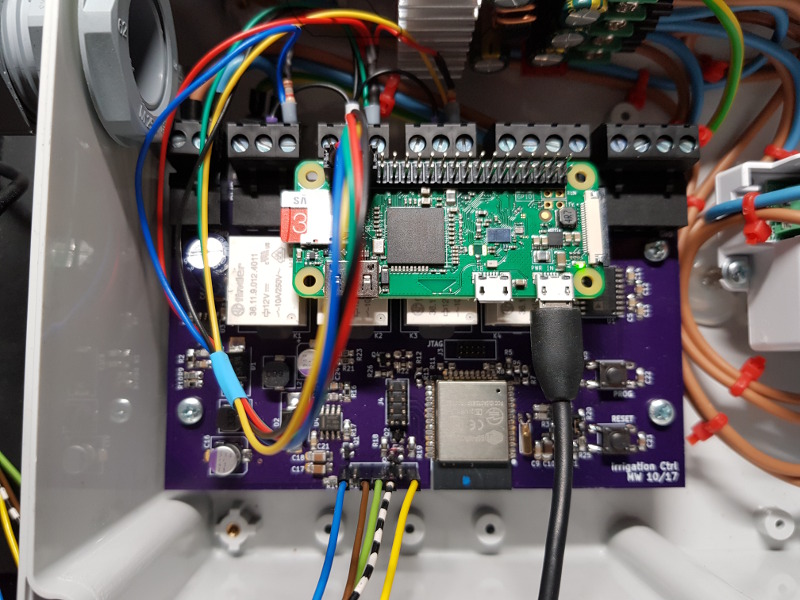
I'm using a slightly modified version of the gpio-monitor found on the Raspberry Pi community forum. Other than that, a serial monitor connected to the debug console is logging the debug output of the controller itself as well. That should give some insight in case something goes wrong.
Here's an example of logged events (time is displayed in UTC):
2018-03-11@06:00:00.59 010
2018-03-11@06:00:15.62 110
2018-03-11@06:00:20.65 111
2018-03-11@06:01:00.74 011
2018-03-11@06:01:15.78 001
2018-03-11@06:01:20.80 000
The start of each line displays the date and time the monitored GPIOs have changed. The next three digits show the current state of the three monitored GPIOs. They represent the state of the MAIN, AUX0 and AUX1 relay outputs (left to right).
MQTT info
Each control loop run will publish a state info via MQTT to a configured MQTT broker. The info is published in JSON format and currently looks like that:
{
    "batteryVoltage": 12958,
    "batteryState": 1,
    "batteryStateStr": "OK",
    "reservoirFillLevel": -2,
    "reservoirState": 3,
    "reservoirStateStr": "DISABLED",
    "activeOutputs": [],
    "activeOutputsStr": [],
    "nextIrrigationEvent": "2018-01-01 07:00:00"
}
The state info contains internal and external sensor data as well as system state data:
- The battery voltage in mV and a state representation (as an integer value and a string, i.e. CRITICAL, LOW, OK, FULL and DISABLED)
- The reservoir fill level in percent multiplied by 10 and a state representation (as an integer value and string, i.e. CRITICAL, LOW, OK and DISABLED).
- Information about currently active outputs (as integer values and strings).
- Date and time of the next occurring irrigation event based on the currently set date and time.
I have chosen to publish the voltage and reservoir fill level in mV and "percent multiplied 10" to prevent the usage of floating point variables as much as possible.